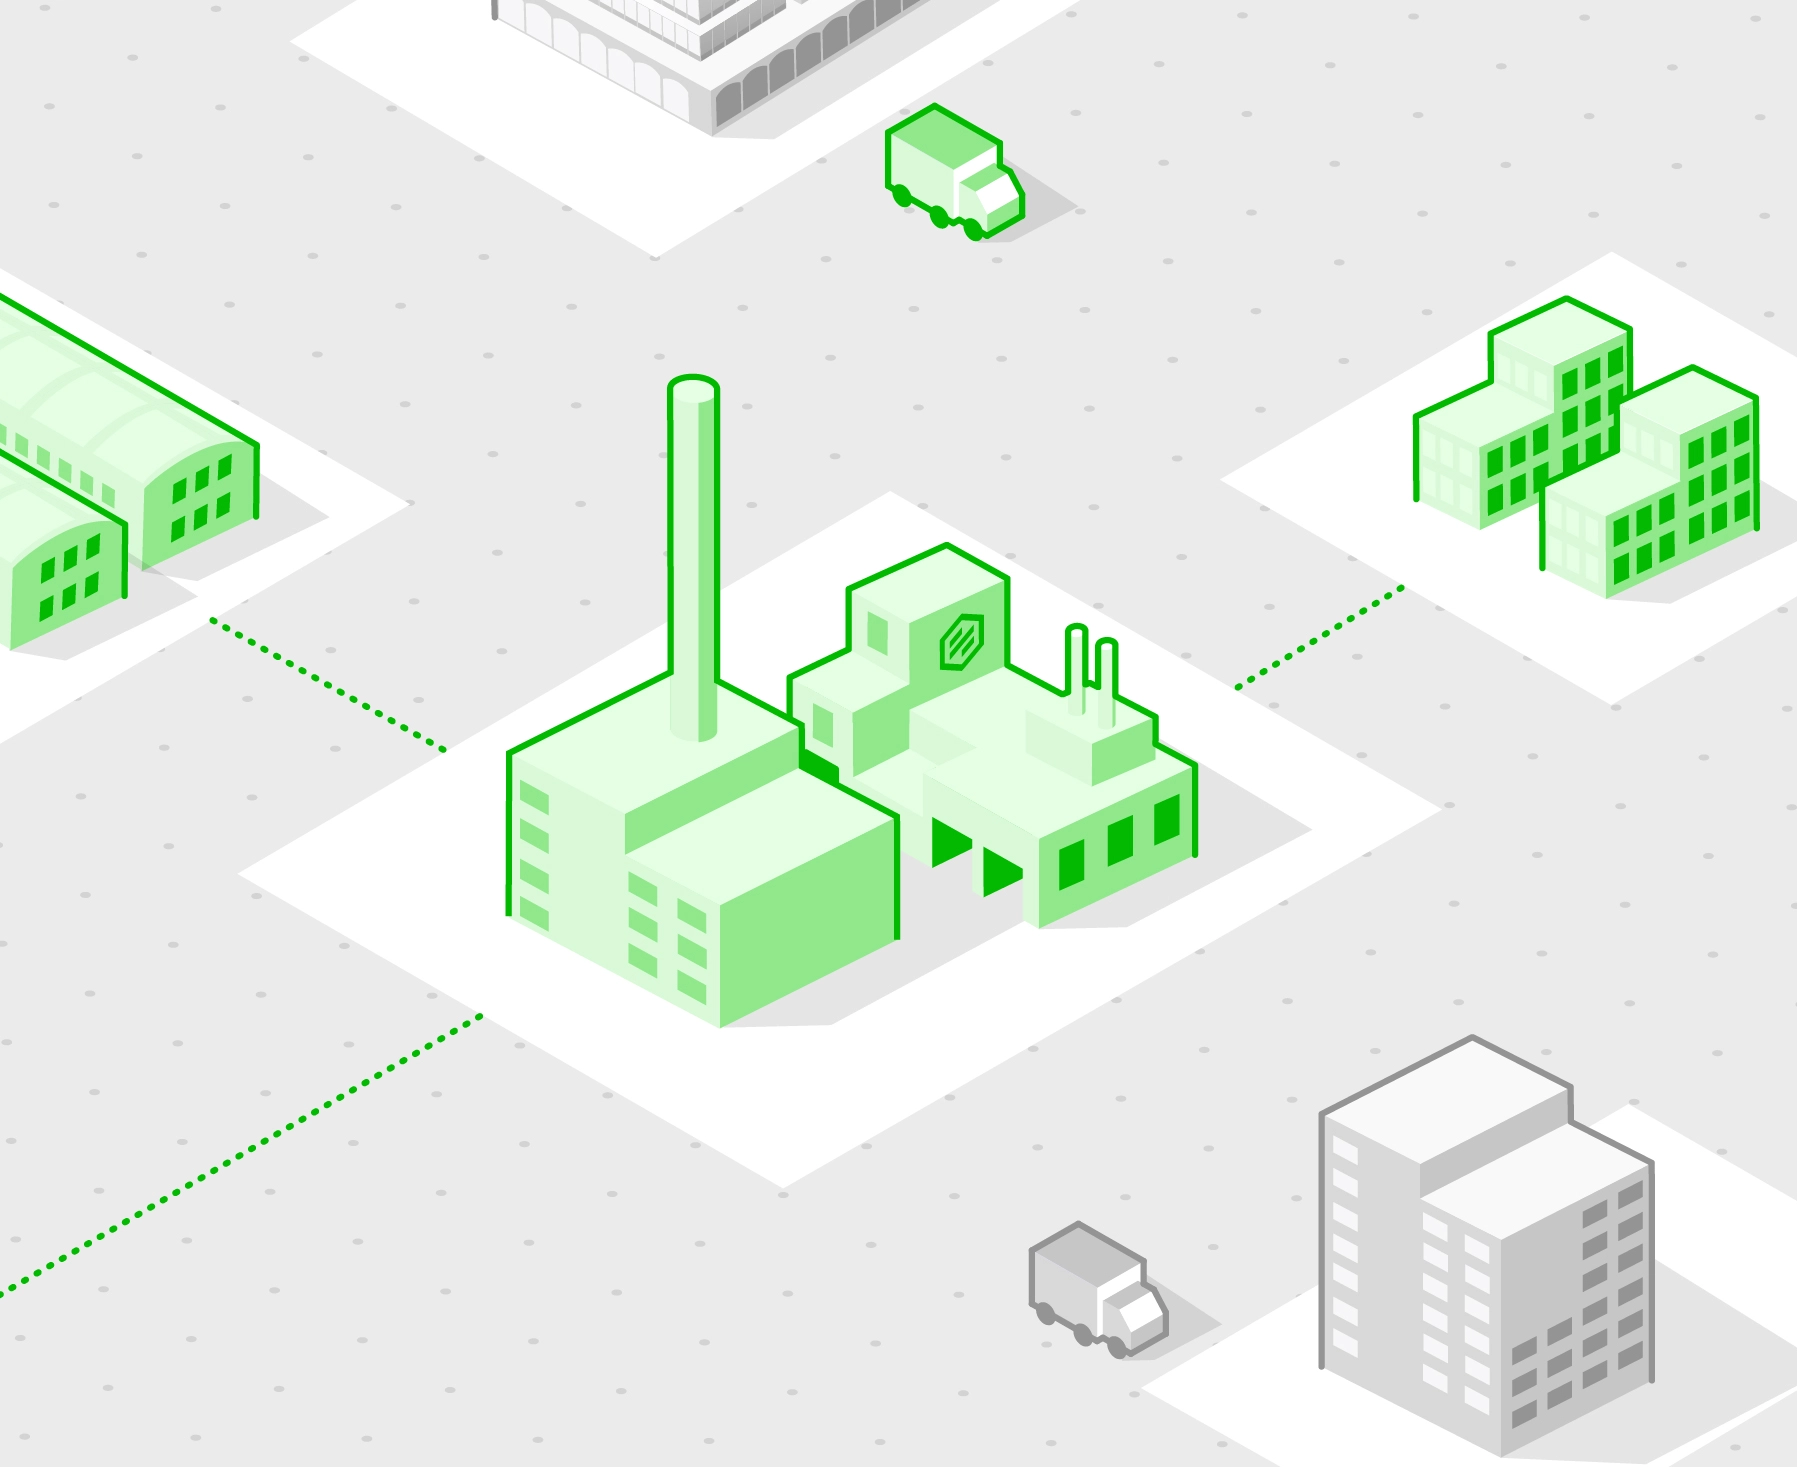
Emissions from transporting and shipping parts from suppliers to customers by air, including transit at our cross-dock locations. Flight paths are simplified as straight lines. The emissions factor follows the GLEC framework by the Smart Freight Centre.
g CO2e = d x w x EFL
d = Distance (km)
w = Weight (kg)
EFL = Logistics emissions factor (g CO2e/t-km)
Our steps towards more sustainable manufacturing
Mapping out a way forward for the industry
Understanding the impact
Manufacturing is a complex industry with an even more complex environmental footprint. Along with part production itself, there are additional considerations, including material sourcing and shipping, waste management and countless other factors. Every one of these steps in the manufacturing supply chain can be improved to reduce impact. We don’t have a ready solution, but we believe that the first step in addressing the problem is to better understand it.
One of the ways we’re taking action is by setting up a taskforce that is committed to mapping out a more sustainable future for manufacturing. Our dedicated team is working hard to identify workable practices that benefit the environment, our business and yours.
Reducing emissions in manufacturing
Our long-term goal is to reduce emissions as much as we can. We want to give you manufacturing solutions that come with a lighter environmental footprint and we want to be transparent about what we’re doing along the way. Our first step was to implement a framework for estimating our CO2 emissions. It is a work in progress, but we wanted to share it in the hopes that it might be useful to other businesses trying to tally up their emissions.

Understand our emissions
There are three different scopes of emissions used by the Greenhouse Gas (GHG) Protocol. For a company like Protolabs Network which operates as a global network, our scope 1 and 2 emissions (fuels, company vehicles, electricity used in our offices, etc) are negligible compared to scope 3 emissions (those generated during manufacturing across our network). Because the vast majority of our emissions fall into the scope 3 category, our logistics, manufacturing and raw material emissions are the focus of this framework. We’re sharing this so that we can be more transparent about our emissions estimates and to provide a helpful resource for others in the industry.
Types of emissions


Emissions generated from the production of raw materials. Emissions factors for different metals and polymers are compiled and then multiplied by the mass of the raw material.
g CO2e = (Vr x ρ) x CEFm
Vr = Volume of the raw material (mm3)
ρ = Density (g/mm3)
EFm = Raw material emissions factor (g CO2e/kg)

Emissions from the manufacturing process. This is the energy it takes to manufacture a part from its raw material multiplied by the carbon intensity of the suppliers’ location. The estimated energy per removed volume is obtained from empirical data from our suppliers.
g CO2e = (Vr - Vp) x K x CI
Vr = Volume of raw material (mm3)
Vp = Volume of the finished part (mm3)
K = kWh of electricity per machined volume (kWh/mm3)
CI = Carbon intensity (g CO2e/kWh)
Emissions example
To see these estimates in action, let’s go through an example using a sample part.

Part volume = 29 cm3
Aluminum density = 2.71 g/cm3
Weight = ~79 grams
Distance travelled = 9700 km
Using the GLEC framework, weight and distance, we calculate 89 grams of CO2e.

Volume of raw material = 165 cm3
Weight of raw material ~450 g
Raw material emissions factor at supplier's location ~20 kg CO2e
Carbon emissions for raw material production ~9 kg of CO2e.

Volume to remove = 136 cm3
K = 0.33 kWh/cm3
Production energy = ~45 kWh
Carbon Intensity = 620 g CO2e/kWh
Carbon emissions from manufacturing ~28 kg of CO2e.
Note that our framework is a simplified model that we’re using to guide our CO2 emissions estimates. It allows us to monitor our impact over time and take decisions to reduce our emissions. We are working on several initiatives to enrich our data and improve our assumptions, which will result in more accurate estimates in future.
Actions we’re taking now and in the future
-
Monitoring our monthly emissions per $ of sales
-
Setting KPIs per region to reduce our emissions per $ of sales
-
Increasing our network of local manufacturers
-
Implementing a sustainability audit and ranking of manufacturing partners
-
Enabling emissions calculations for 3D printing, injection molding and sheet metal fabrication
-
Increasing reliability and accuracy across our platform


